Reorder Columns in Your Report
This guide is tailored for those looking to customize their Standard Report layout by reorganizing columns. We will explore two typical column types and the essential properties that require manual adjustment when relocating a column within the report. By showing how to swap the Quantity and Unit Cost columns, you will have a solid starting point for repositioning other columns in your report.
 Quantity and Unit columns before swapping.
 Quantity and Unit columns after swapping.
5-Minute Video
Getting Started
1. Open the report inside the End User Report Designer
2. Inside the report, identify the section that contains the line item groupings and details
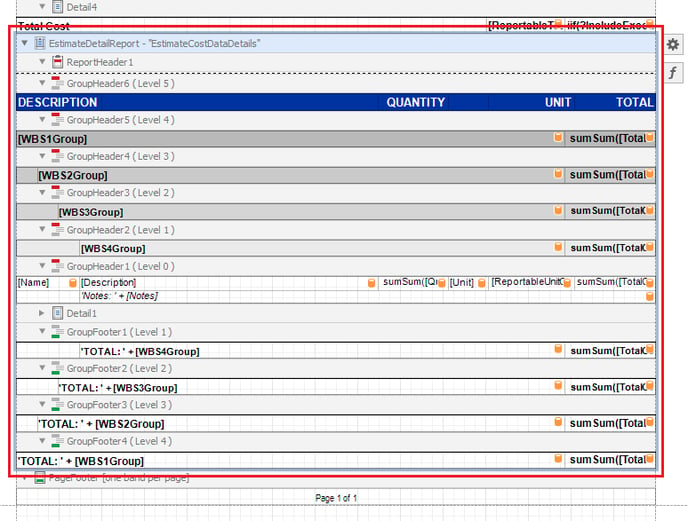 When selected, the line item groupings and details section has a blue border.
3. Inside that section, select the middle GroupHeader band (between WBS Groupings) that contains the line item's information.
 The GroupHeader1 band includes line item details like Description, Quantity, and Cost.
4. Locate the Quantity and ReportableUnitCost columns on either side of the Unit column.
 In the Standard Owners Report, the Quantity is located in the third column from the left, while ReportableUnitCost can be found in the second column from the right.
The Unit column represents the Unit of Measure column inside Estimate View. The ReportableUnitCost column represents the sum of the Unit Cost column inside Estimate View and any distributed cost based on the applied report-level filters.
Reorder Column
1. Identify the column you want to move and note its setup.
a. Select the ReportableUnitCost column
b. Click the ⚙️ (Gear) button
c. Expression - used to specify what data to populate in the field
d. Format String - typically used to format numerical values displayed in the report.
The Format String "{0:c2}" specifies that the numerical value will be displayed as a currency with 2 decimal places.
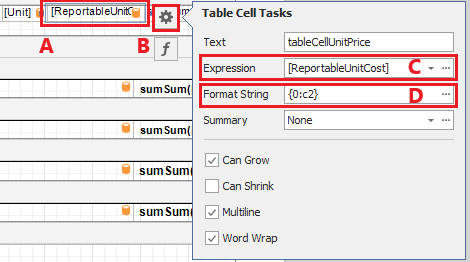 The Properties of the ReportableUnitCost column.
When the Expression property is populated, the report will disregard the Text property.
2. Locate the new position for that column. For this example, the ReportableUnitCost will be located to the right of the Description column.
3. Select the Description column, right-click, and select Insert and Cell.
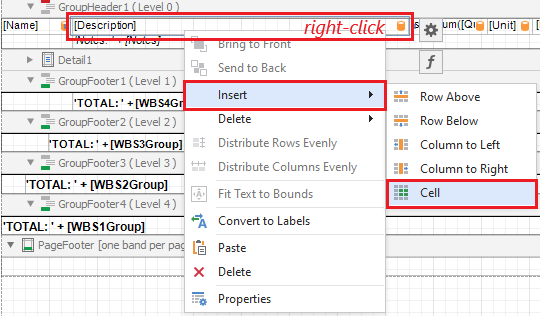 The Insert Cell operation will add a new cell to the right.
4. Select the new cell, click the ⚙️ button, and populate the Expression and Format String information from the original ReportableUnitCost column.
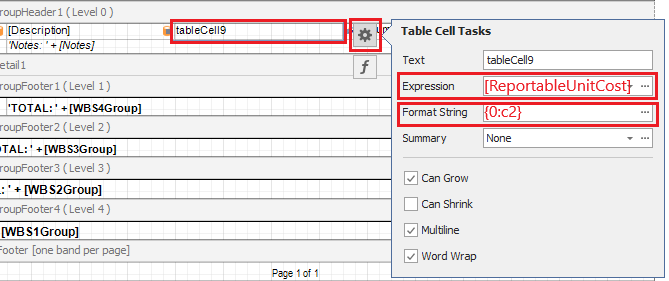 Set the Expression and Format String properties for the new cell.
5. With the cell still selected, use the top menu bar to adjust the text's alignment to Left, Center, or Right based on your formatting preference.
 The Right Alignment button is selected in the top menu bar.
Reorder Summed Column
1. Identify the column you want to move and note its setup.
a. Select the Quantity column
b. Click the ⚙️ (Gear) button
c. Format String - typically used to format numerical values displayed in the report.
The Format String "{0:n2}" specifies that the numerical value will be displayed as a number with 2 decimal places.
d. Summary - used to sum a value for grouped line items.
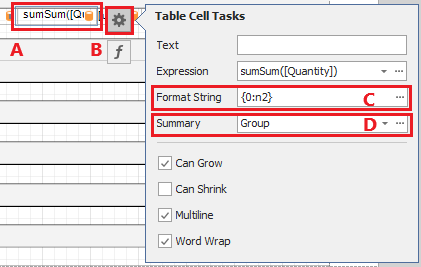 The Properties of the Quantity column.
The Expression property will be automatically populated based on the configuration within the Summary Editor window.
2. Clear out the information in the original ReportableUnitCost column, so that it can be repurposed for displaying the Quantity.
a. Select the original ReportableUnitCost column to the right of the Unit column.
b. Click the ⚙️ (Gear) button
c. Delete the contents inside the Text property
d. Delete the contents inside the Expression property
e. Delete the contents inside the Format String property
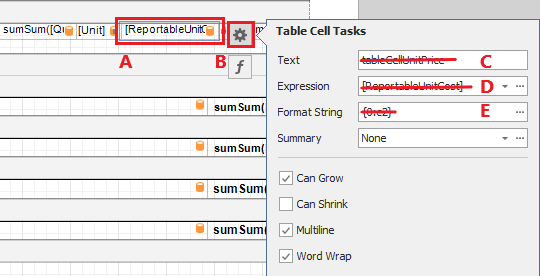 Remove any information within the Table Cell Tasks popup for the existing ReportableUnitCost column.
3. With the Table Cell Tasks popup still open, click the … (ellipsis) button within the Summary property.
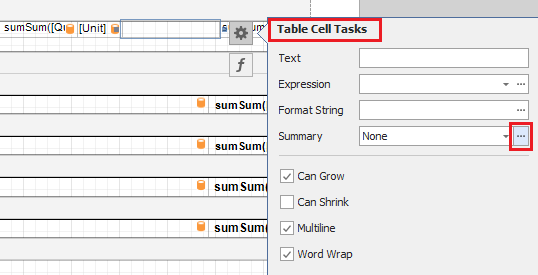 Summary property's ellipsis button inside the Table Cell Tasks popup.
4. Inside the resulting Summary Editor window, configure the following:
a. Summary running = Group
Typically, the Summary running value matches the type of Header that holds the control. For instance, a summary in a GroupHeader uses Group, while one in a ReportHeader uses Report.
b. Argument expression = [Quantity]
c. Click the OK button
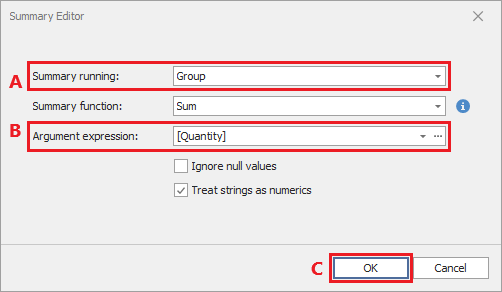 Configuration to sum the Quantity value for grouped line items in GroupHeader1.
The report groups line items by common properties and aggregates their Quantity and Total Cost values, ensuring that the printed Quantity matches the line items' rolled-up Quantity in the estimate.
5. Inside the Table Cell Tasks popup, populate the Format String using the original Quantity column's information.
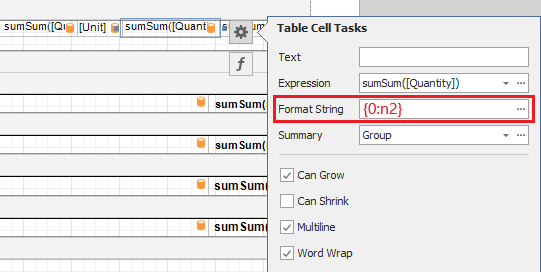 Set the Format String value for the new Quantity column.
6. After reordering, you will have 1 ReportableUnitCost column and 2 Quantity columns.
a. New ReportableUnitCost column
b. Old Quantity column
c. New Quantity column (previously ReportableUnitCost)
![]() The result after reordering the Quantity and ReportableUnitCost columns.
The result after reordering the Quantity and ReportableUnitCost columns.
Clean Up
1. Delete the old Quantity column (see B in the above screenshot) by right-clicking that column, and then selecting Delete and Cell.
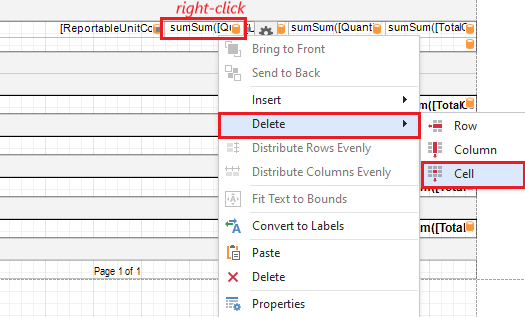 Delete the old Quantity column.
2. (Optional) Select the Description or ReportableUnitCost column and adjust the column's width by dragging the adjoining border with the ↔ mouse icon.
 The right cell border is highlighted on the selected Description cell.
3. Update the text in the column headers for the top GroupHeader band (located above the WBS Groupings) to accurately represent the content of the newly rearranged columns.
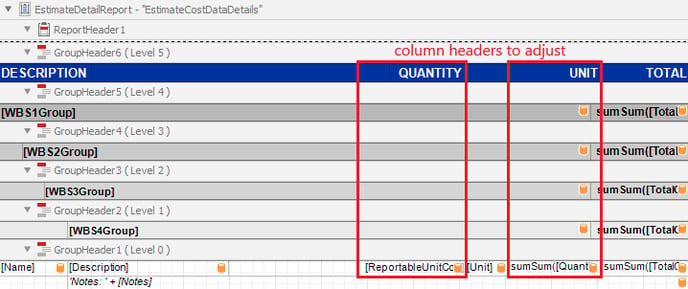 Without changing the column headers, ReportableUnitCost will print under "Quantity" and Quantity will print under "Unit".
4. Save and run your report.
Want more content? Let us know by filling out our Training Ideas Submission Form