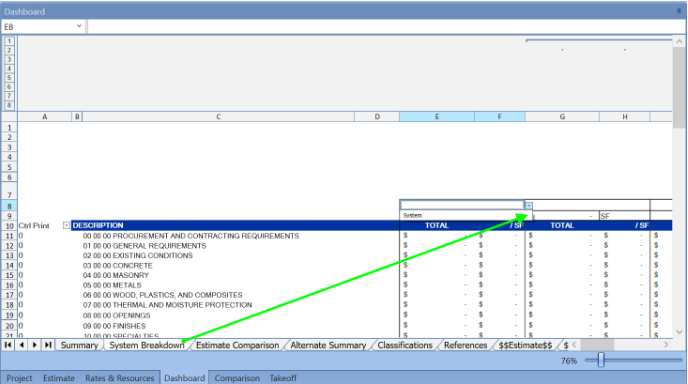
Here is a walk overall walk-through of the Dashboard in Estimator.
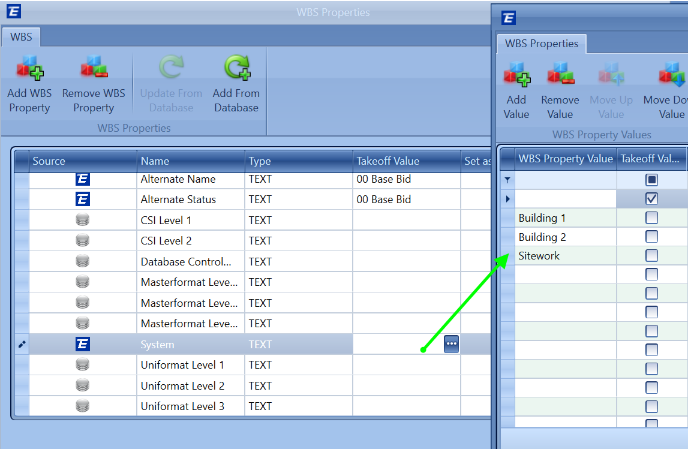
System WBS values are required on the line items so the Dashboard will show the data in the fields.
 The Dashboard in DESTINI Estimator can display important estimate data in easy-to-read charts, summaries, and reports that you create and is not reliant upon any complicated or difficult-to-use report designer tools or programs.
How to Save the Dashboard: Clic the Save As button and you can save the file locally and make changes to reupload.
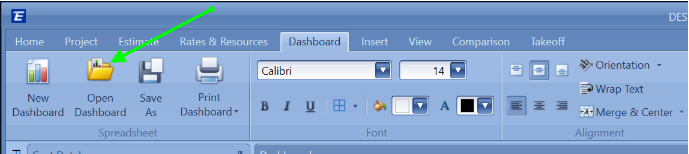
How to load a new Dashboard: Click the Open tab and navigate to your new Dashboard and that will overwrite the current one that is loaded.
The dashboard allows Excel reports to be driven off of values in Estimator.
How it works:
As an Estimate is built, the Dashboard automatically populates live data from the Estimate. Spreadsheets can be created with formulas included that link the data from the Estimate to be used for reporting. The Excel file built for use as a Dashboard can include functionality such as charts, summaries, and other breakdowns of cost in a format that is specific to a user or owner.
We provide a sample Dashboard (Excel file) which can be found in the Training Database or in this article at the bottom in the attachment section.
These four easy steps will help get you set up:
1) In Estimator, select the Dashboard tab, then select “Save Dashboard”. (It will save out a pre-populated spreadsheet as an XLS file.)
Note: It might be easier to start with a simple estimate so that you can more easily relate to the data.
2) Next, open the Dashboard file in Excel to create the desired charts, summaries, and reports and link back to the data from the $$ tabs created by Estimator.
3) Save in Excel.
4) Open the Dashboard Excel file in Estimator by clicking “Open Dashboard”.
Note 1: Upon opening the dashboard, the source data is updated providing you with a current snapshot of the estimate information. If changes are made to any of the values in the estimate, the corresponding $$ tabs will also be automatically updated as well as any chart, summary, or report that uses that data; eliminating the need to make multiple updates in various applications.
Note 2: Once the initial file has been created in Excel, it can be re-used in future projects, simply by opening the file in Estimator using the Open Dashboard function. For this reason, you might choose to save a version of your Excel file as the “template” file. (Ex: Dashboard Template.xls)
Here is a deeper dive into how it works...
The purpose of the Dashboard is to provide Excel-like access to all of the information within the open estimate. Each $$ sheet in the Dashboard contains information that is automatically kept in sync with the open estimate. These $$ sheets can be referenced to create dynamic reports, dashboards, etc. that are updated in real-time as changes are made to the estimate.
To provide access to the information within the open estimate, Estimator creates 11 spreadsheet tabs (4 from just the open estimate and 7 for comparison purposes with other estimates) that are added to any MSExcel file imported into the application. These sheets are:
$$Line Items$$
$$Systems$$
$$Fees$$
$$WBS Properties$$
$$System Comparison$$
$$Meta Data Comparison$$
$$Direct Cost Comparison$$
$$Indirect Cost Comparison$$
$$WBS Comparison$$
$$Group Level Comparison$$
$$Detail Level Comparison$$
From these sheets, you will have all of the data from the open estimate to build charts, graphs, summaries, etc. in any format you or your owner would like to see. You could create standardized templates that could be used throughout your organization and with other estimates.
Breakdown of Information found in each sheet.
The $$Estimate$$ sheet connects to the Project View with the project information. The information in Column B automatically is sorted alphabetically. This makes VLOOKUP references possible.
The $$Line items$$ sheet provides information for each Line Item of the Estimate such as all associated costs (labor, sub, material, equipment, other, unit & aggregate), assembly information, WBS properties, etc. All the available columns headers in the Estimate View will be visible in this sheet.
The $$Fees$$ sheet provides information that includes fee type, total cost, the total cost per area, etc. for each fee in the Estimate.
The $$WBS Properties$$ sheet provides a list of all of the WBS Properties of the Estimate. The Default Value will display if a Default Value is selected in the WBS Property table either in Data Manager or the Estimate.
In addition to the data in the open estimate, the Dashboard also makes reporting on estimate comparisons straightforward by syncing estimate comparison data with various $$ sheets as well. Like other $$ sheets, these comparison sheets are also kept in sync automatically and can be referenced to create dynamic reports, dashboards, etc.
Note 3: the comparison sheets will contain information from the baseline estimate and information from any estimate added for comparison.
The $$Detail Level Comparison$$ sheet shows a detailed comparison of every line item loaded in the Comparison View and how each line item relates back to the baseline value. Every aspect of the line item is made available in this sheet to give a detailed look at the deltas between the baseline estimate and each estimate loaded in the comparison.
The $$Meta Data Comparison$$ sheet lists the values of metadata, also known as Project Properties from Project View, from the baseline Estimate and any Estimates added for comparison in the Comparison View. (i.e. Parking Area, Number of Floors, Total Building Area). The standard project properties that will always be included are Project Type, Total Building Area, and Total Site Area.
The $$Direct Cost Comparison$$ This sheet lists the total distributed direct costs for each Estimate loaded in the comparison. Distributed fees are included in the Total Cost. Go to the Fee Table to verify the base Estimate amount against the Distributed Direct Cost or locate and sum the Grand Total Cost in the Estimate View.
The $$Indirect Cost Comparison$$ sheet lists the Type, Amount, and Total Cost for each non-distributed Fee from the Estimates being compared.
The $$WBS Comparison$$ sheet is driven by the WBS Property Cost breakdown in the Comparison View and lists the total cost of each WBS Property Value from the baseline Estimate across any Estimates added for comparison.
The $$Group Level Comparison$$ sheet is driven by the Detail Comparison breakdown in the Comparison View and lists the aggregated costs by the selected WBS Property in the baseline compared to each of the added Estimates along with the corresponding Estimate variances.
What Else can you do with all that data?
Since almost ANY and ALL data from the estimate is provided via the $$ sheets, you can set up presentation templates, estimate reports, bar charts, graphs, etc., and creatively display information from each of your projects.
As an example, you could create an estimate summary tab in your dashboard workbook (MSExcel file) that summarizes the estimate information by Uniformat Category, 16 CSI, or any other WBS breakdown structure in your database.
Another example is that you could create a Cover Sheet that populates with an Executive cost summary, the Gross Square Footage, and include a place for an image from the architect.
Charts, graphs, and shapes can also be easily added to your Dashboard. In the Dashboard view, click on the Insert tab at the top of the screen to display the options.
Select the type of graph you want to see. This will activate the Excel-like Chart Tools options -- Design, Layout, and Format. Design lets you select the data you want to be included in your graph. The layout gives you access to labels, set axes preferences, etc. The format lets you add fill and outline color.
Standard Dashboard.xlsx