PLEASE READ THIS ARTICLE IN ITS ENTIRETY BEFORE USING THIS DASHBOARD
This cost database management tool was created to give the database manager the ability to maintain the quality of the database by easily understanding its contents. This includes ensuring that it is clean, up-to-date, and relevant, as well as the relationship of content created and its usage throughout the database.
Table of Content
USE CASES:
#1 – Variable Search
As a database manager, I may need to modify an existing variable, (Example: change “Wall_Concrete_Volume”, “Foundation_Wall_Concrete_Volume”). However, since Data Manager doesn’t automatically update variables throughout the database, making a change will break the assemblies and choices that are consuming this variable. Therefore, I need to be able to easily find any instance of a variable and also be able to identify where that variable is being used in Assembly Item formulas, Choice Item formulas, and regular (or System) Formulas, then manually update the variables in each of these locations.
#2 – Line Item Search
As a database manager, I need to be able to discover if a specific line item is a stand-alone item (which is okay), if it has been orphaned/abandoned (not good), or if it is actively being consumed in an assembly or choice (good). As the database contains 168 assemblies, 50+ Choices, and 15,000 line items a manual search would be time consuming and laborious.
#3 – System Formula Search
As a database manager, I need to be able to identify where a System Formula is being consumed. System Formulas can be consumed by Line Items, Assemblies, and/or Choices.
#4 – Choices Search
As a database manager, I need to be able to identify where Choices are being consumed by which Assemblies.
DEFINITIONS:
Variables – Variables are a basic database construct and consist of a human-readable text string, that represents a number or value. For Example, “Concrete_Strength” may represent a value of 3,000. Variables exist in their own database table and have a unique, machine assigned, ID or Code.
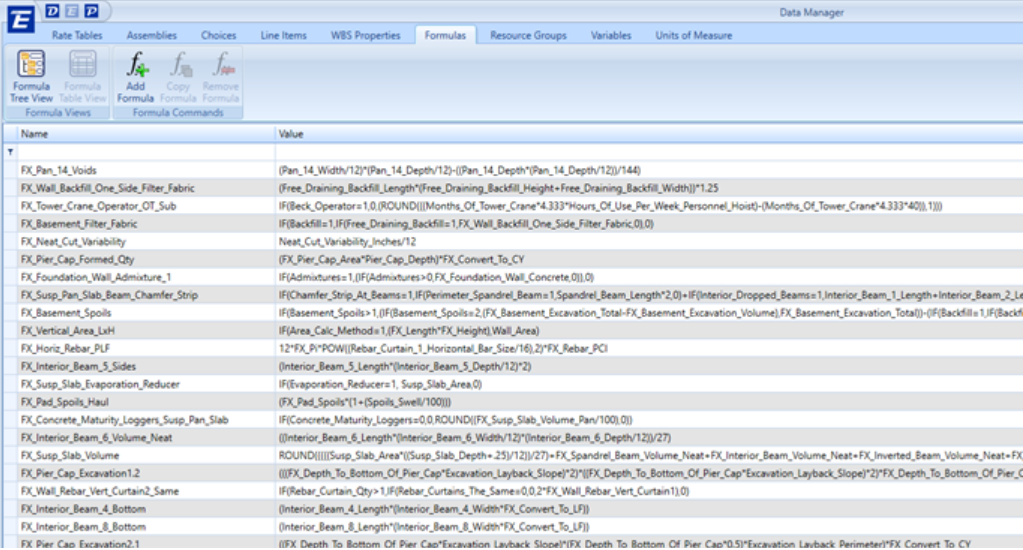
Formulas – DESTINI Data Manager “System” Formulas are similar to variables, in that they are represent as a human-readable text string, and represent either single values, or a mathematical relationship expressed by other variables, numbers, math operators, and/or functions. “System” Formulas exist in their own database table and have a unique, machine assigned, ID or Code.
Line Items – Individual instances of items in the databases. Line items exist in their own database table, and have a unique, machine assigned, ID or Code, which is not exposed through the GUI to the user. Line items are often referenced/consumed by Assemblies and Choices. Sometimes, line items are stand-alone items and are not consumed by assemblies or choices. Line Items can have formulas assigned to them, although the Beck Best Practice is to leave the Line Item Formula as “0”./
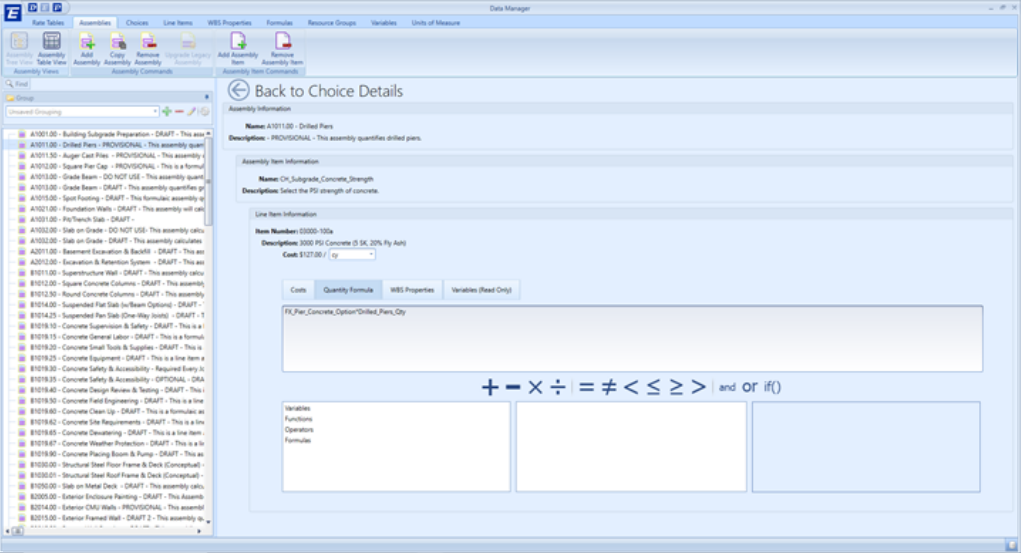
Choices - Choices are groupings of Line Items, intended to be consumed inside of assemblies. Users can think of Choices as a menu of Line Items. Once a Choice is placed inside of an Assembly, the user can add a Choice Item Quantity formula, which is similar to an Assembly Item Quantity Formula. Choice Item Quantity formulas determine the quantity that will be applied to the selected Line Item within the Choice.
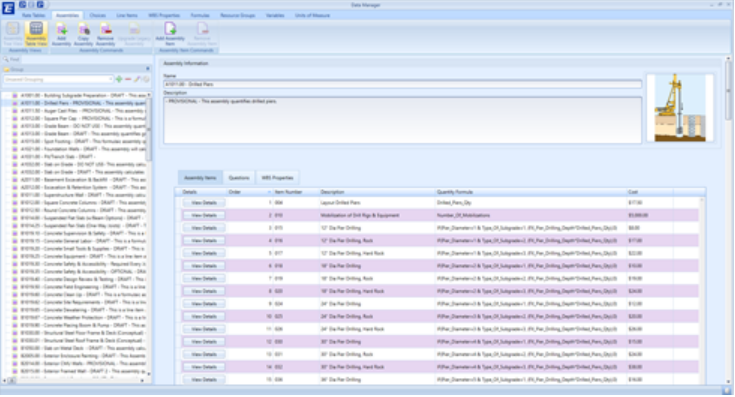
Assemblies – Assemblies are groups of Line Items, and/or Choices, and then provide an the ability to establish a quantity formula, or a conditional/ evaluation formula to determine which Line Items ultimately get used in the Assembly.
Assembly Item Quantity formula –These are formulas (notice the lower case “f”), representing a mathematical relationship expressed by other variables, numbers, math operators, and/or functions that are tied to an individual Line Item.
Choice Item Quantity formula – These are formulas (notice the lower case “f”), representing a mathematical relationship expressed by other variables, numbers, math operators, and/or functions that are tied to an individual Line Item, within a Choice.
System Formulas - These are “system” Formulas (notice the upper case “F”), represented by a text string, and representing a mathematical relationship expressed by other variables, numbers, math operators, and/or functions that are not necessarily tied to anything in particular.
SETTING UP THE DASHBOARD
1. To download the dashboard, click this link: Cost Database Management Power BI file download
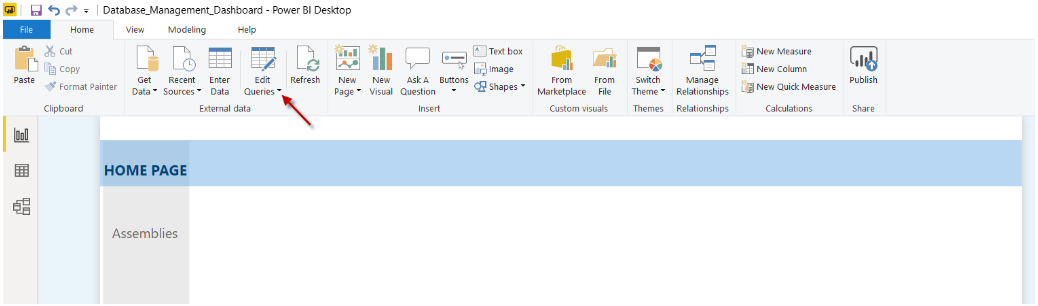
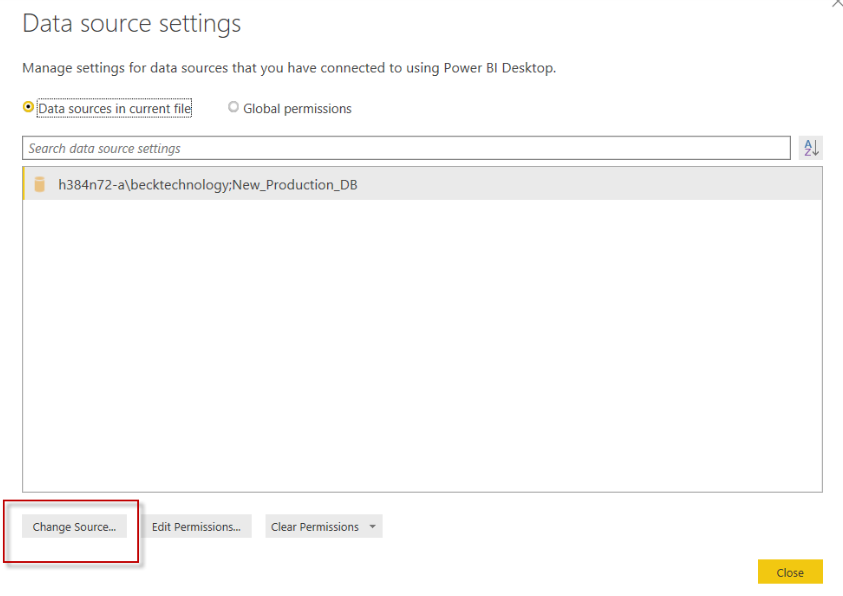
2. Open the Power BI file and click the side arrow next to Edit Queries and click Data source settings:
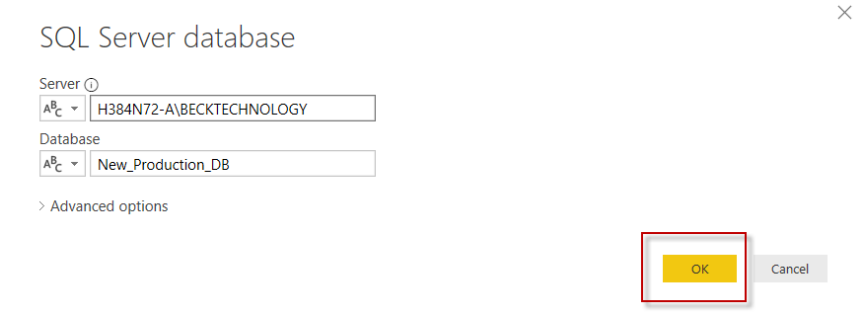
3. Click Change Source and Then enter your database server name and instance name and click OK.
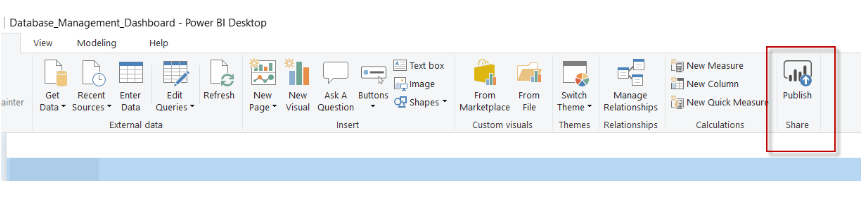
4. Click Apply Changes at the top of the page.
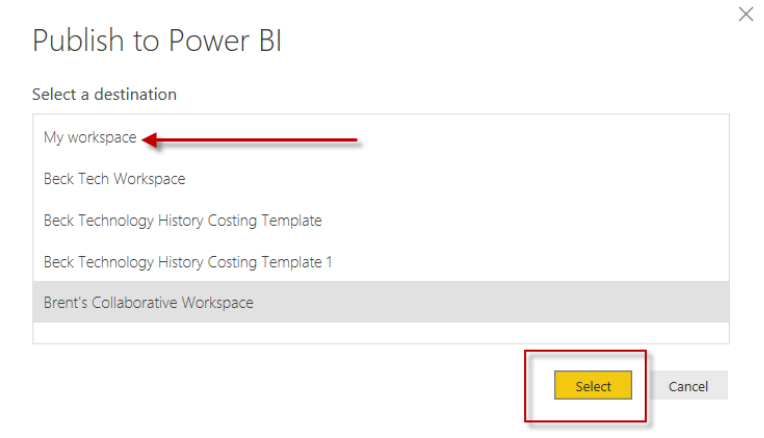
5. Click Publish and choose "My workspace" and Click "Select."
USING YOUR DASHBOARD ON THE WEB
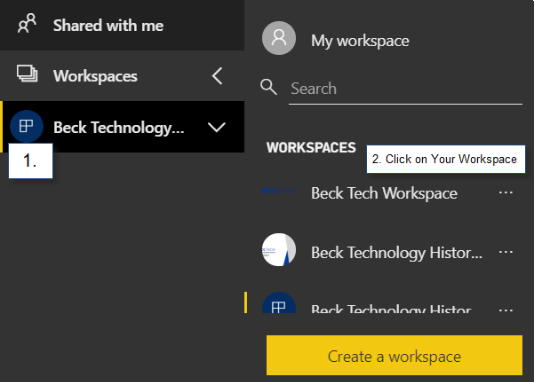
1. To use your Dashboard in the Power BI online space, click login to Power BI online. Select your Workspace called "My Workspace."
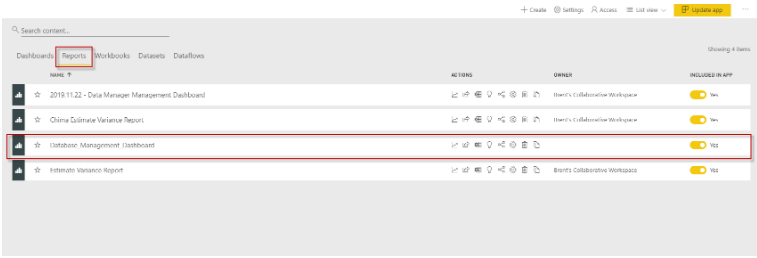
2. Click on Reports, then click on your dashboard name.
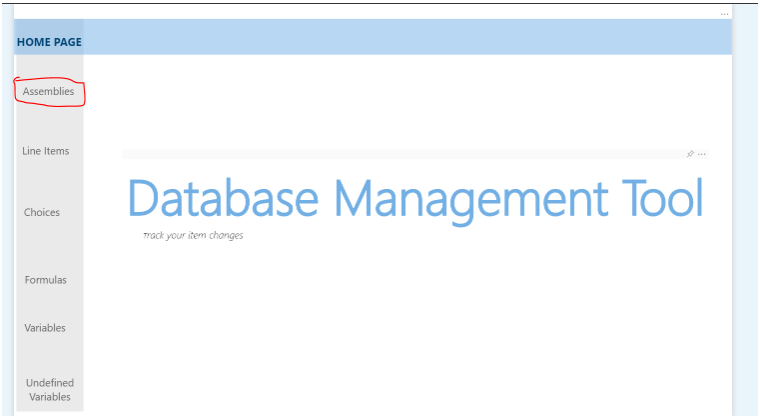
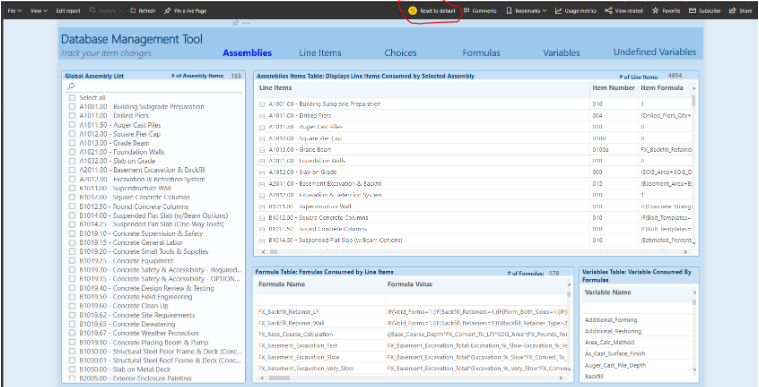
3. Click On Assemblies and then click on Reset to default. NOTE: Repeat this step whenever you use the dashboard online.
4. You are good to go!