How to Add New Column To Report
This article is designed to help individuals with a basic understanding of reporting who are looking to customize their existing reports to better suit their business needs.
We will guide you step-by-step on how to add a new calculated column to a custom report by adding a % of Total column to your Standard Report.
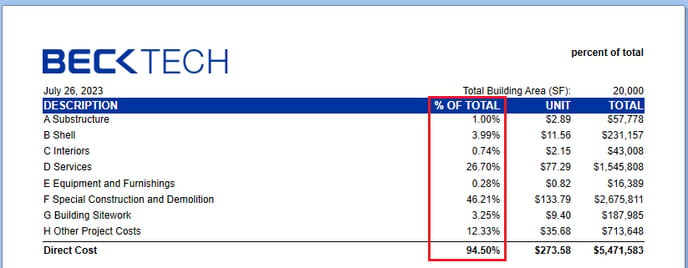 New Column inside Report Preview
6-Minute Video
Steps
- Open the report inside the End User Report Designer
- Launch the Calculated Field Collection Editor
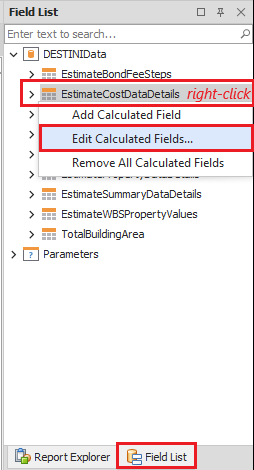
- Add a new calculated field for Direct Cost
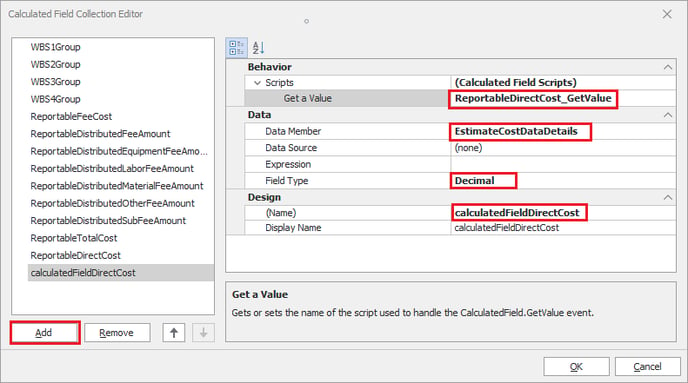
- Get a Value = ReportableDirectCost_GetValue
- Data Manager = table destination for field
- Use a descriptive name (i.e. calculatedFieldDirectCost)
Our new Standard Reports have a built-in script called ReportableDirectCost_GetValue. This script computes the Direct Cost of the filtered report, excluding distributed fees.
4. Repeat Step 3 for Total Cost
a. Get a Value = ReportableTotalCost_GetValue
b. Use a descriptive name (i.e. calculatedFieldTotalCost)
Our new Standard Reports have a built-in script called ReportableTotalCost_GetValue. This script computes the Total Cost of the filtered report, including distributed fees.
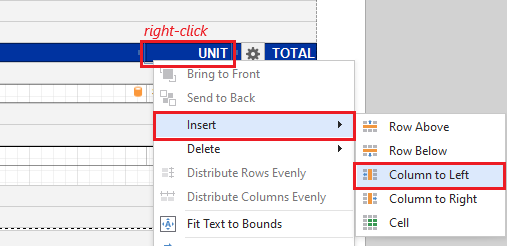
5. Inside the Designer, insert columns in ReportHeader, GroupHeader, and/or ReportFooter
6. In the GroupHeader, configure a group summary to calculate % of Total
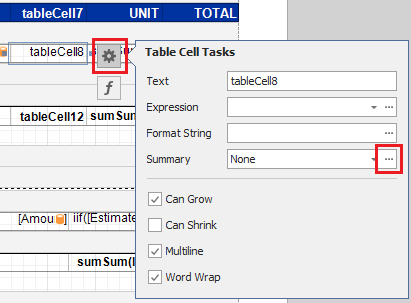
a. Configure the Summary Editor based on the band type (i.e. Group, Report)
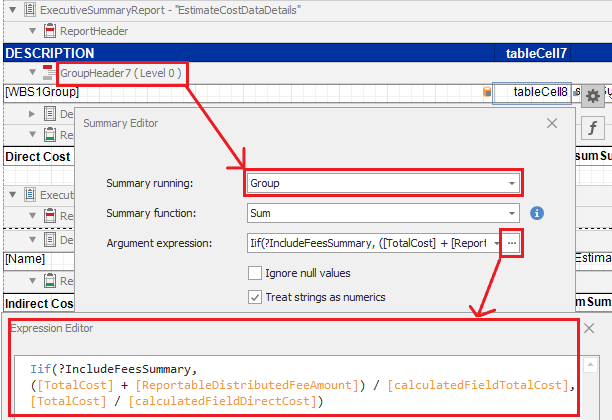
b. Format as a percentage
7. Repeat Step 6 for ReportFooter
a. Summary running = Report
8. Update the ReportHeader label
9. Resize columns as needed
10. Save and run the report
Want more content? Let us know by filling out our Training Ideas Submission Form