Summary Dashboard Overview
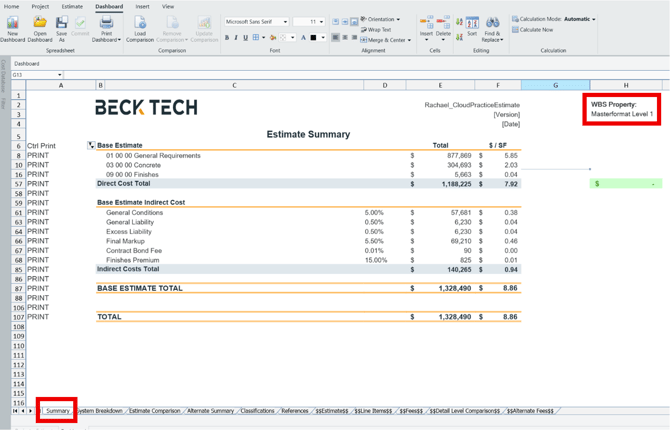
The Summary Dashboard provides a one‑level WBS summary of the data in your DESTINI Cloud estimate. It is the first tab in the Standard Dashboard and can be used either as a client deliverable or as a live snapshot of estimate data while you are actively estimating.
How Data Flows into the Summary Dashboard
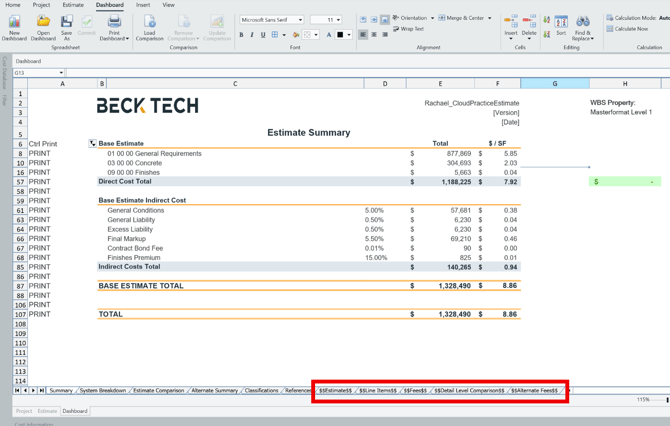
The Summary Dashboard summarizes data that exists in the $$ sheets, which are populated directly from the Estimate View. As changes are made in the estimate, the data in these sheets, and subsequently the dashboard, updates automatically.
Data sources include:
- Cost items and WBS Properties from the Estimate View (Base Estimate and Alternates), which populate the $$Line Items$$ tab
- Project Properties from the Project View, which populate the $$Estimates$$ tab
- Base Estimate fees, which populate the $$Fees$$ tab
- Alternate fees, which populate the $$Alternate Fees$$ tab
For costs to aggregate correctly on the Summary Dashboard, the WBS Property names and values used in the estimate must exactly match the values listed on the Classification tab.
Dashboard Layout
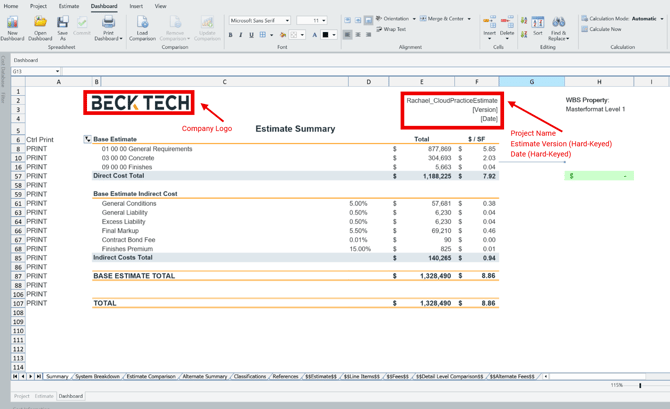
Header
The Summary Dashboard header includes:
-
Company Logo
-
Project Name
-
The Project Name is linked directly to the Project Name lookup on the References tab.
-
-
Estimate Version
-
Hard‑keyed entries
-
-
Date
-
Hard‑keyed entries
-
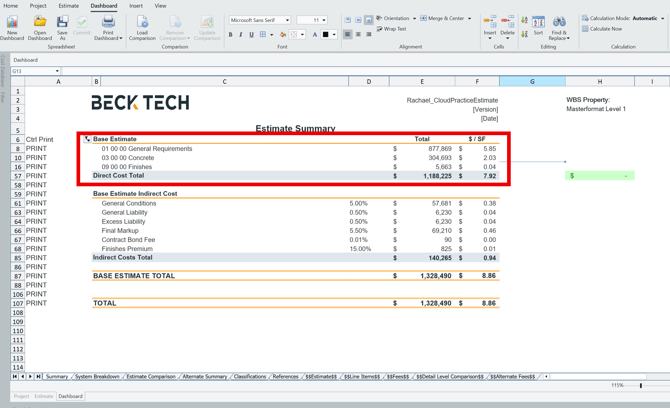
Base Estimate
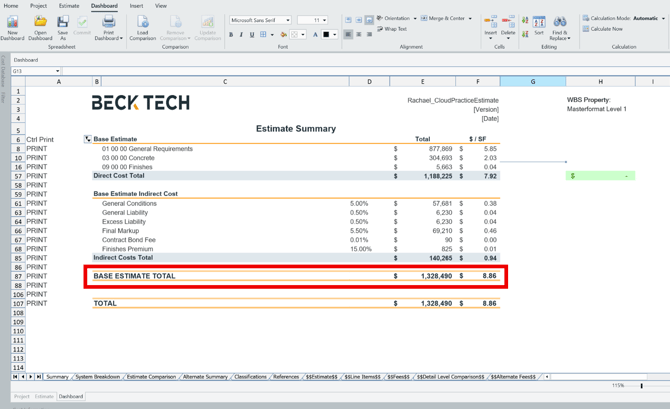
The Base Estimate section summarizes cost items in the Base Estimate using a one‑level WBS structure.
- The WBS Property used for sorting is selected using the drop‑down in cell H3
- This drop‑down includes the WBS Properties defined on the Classifications tab
- The WBS Property list on the Summary Dashboard updates based on the selected WBS Property
Column details:
- Column E displays the Total Distributed Direct Cost, which should match the Burdened Total Cost column in the Estimate View
- Column F displays Cost per SF, calculated as Total Distributed Direct Cost divided by Total Building Area
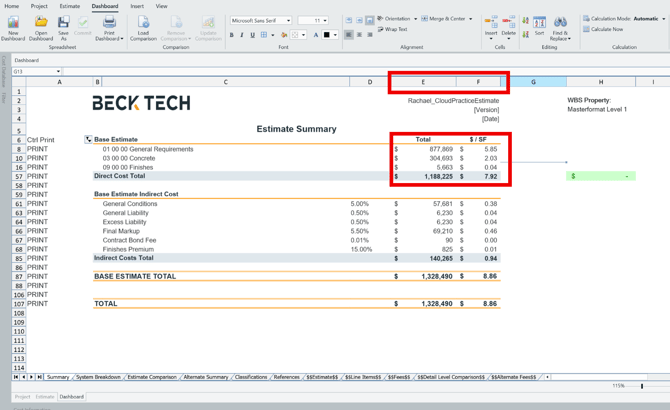
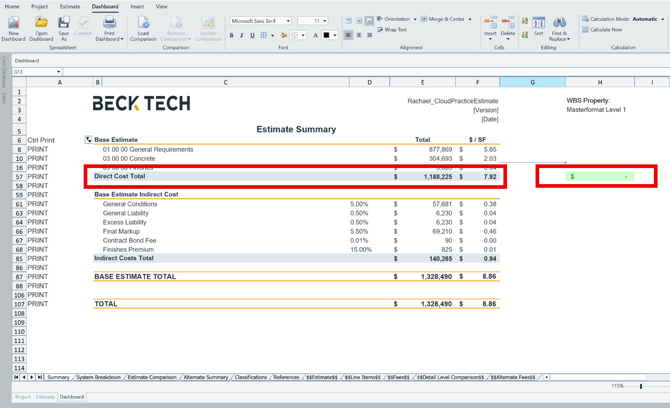
The Direct Cost Total is the sum of all Distributed Direct Costs in the Base Estimate.
A Direct Cost Check is located in cell H57:
- When the Total Direct Cost matches the Burdened Total Cost column in the Estimate View, the value displays as 0 and appears green
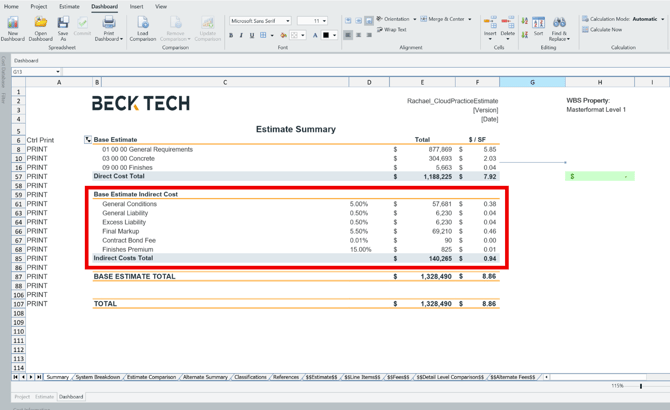
Base Estimate Indirect Costs
The Base Estimate Indirect Costs section displays fees defined in the Fee Editor.
For each fee, the following information is shown:
- Fee Name
- Fee Percentage or LSUM
- Amount
- $/SF
Additional details:
- Distributed fees and subtotals are not displayed in this section
- Fees must be turned on in the Fee Editor to appear
- The Indirect Cost Total includes only non‑distributed fees and does not include subtotals from the fee table
Base Estimate Total
The Base Estimate Total is calculated as the sum of:
- Base Estimate Distributed Direct Costs
- Base Estimate Indirect Costs
Accepted Alternates
The Accepted Alternates section displays Alternates with a status of Accepted in the estimate.
For each accepted alternate, the following information is shown:
- Alternate Name
- Total Cost
- $/SF
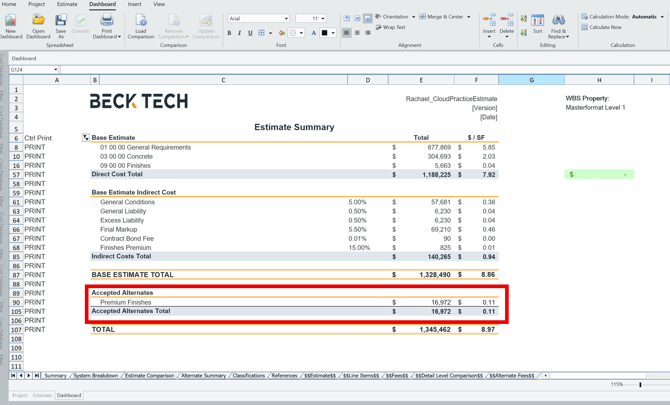
The Total Cost includes both Direct and Indirect Costs.
The Accepted Alternates Total is the sum of all Accepted Alternates.
Ctrl Print Filter
The Ctrl Print filter is located in column A and allows you to filter out rows with a $0 value.
To use the filter:
- Select the arrow in cell A6
- Uncheck 0
- Select OK
Relationship to Other Dashboards
The Summary Dashboard provides a high‑level overview of the cost breakdown for the current estimate.
- For a system‑level view, use the System Breakdown Dashboard
- To compare multiple estimates, use the Estimate Comparison Dashboard
- The Alternates Summary Dashboard summarizes all Alternates in the estimate but does not include the Base Estimate
Known Behaviors & Gotchas
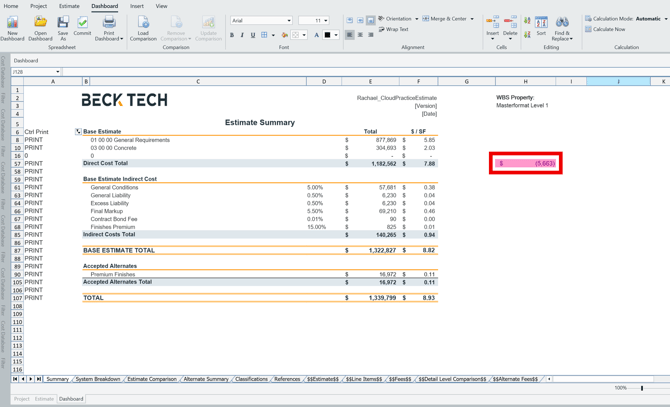
Missing Costs in the Direct Cost Total
The most common issue encountered is missing costs in the Direct Cost Total.
- If the Direct Cost Check in cell H57 displays red, the Total Direct Cost does not match the Burdened Total Cost column in the Estimate View
- This is most commonly caused by:
- A typo in a WBS Property value, or
- A WBS Property used in the estimate that does not exist on the Classifications tab
How to Validate WBS Properties
- Navigate to the Estimate View
- Open the Filter Pane
- Configure the Filter Pane to group by the same WBS Property used on the Summary Dashboard
- Compare the WBS Property values listed in the Filter Pane with those displayed in the Base Estimate section of the Summary Dashboard
If differences are found, you can:
- Filter to the affected line items in the estimate and correct the typo, or
- Add the missing WBS Property to the Classifications sheet
Ctrl Print Filter Not Updating
Another common issue occurs when the Ctrl Print filter appears collapsed.
This can happen when a cost item is added to the estimate with a WBS Property that did not previously exist. The Ctrl Print filter does not automatically refresh and must be updated manually.
To refresh the filter:
- Select the arrow in cell A6
- Check 0
- Uncheck 0
- Select OK